3.1 Importing vector data with sf
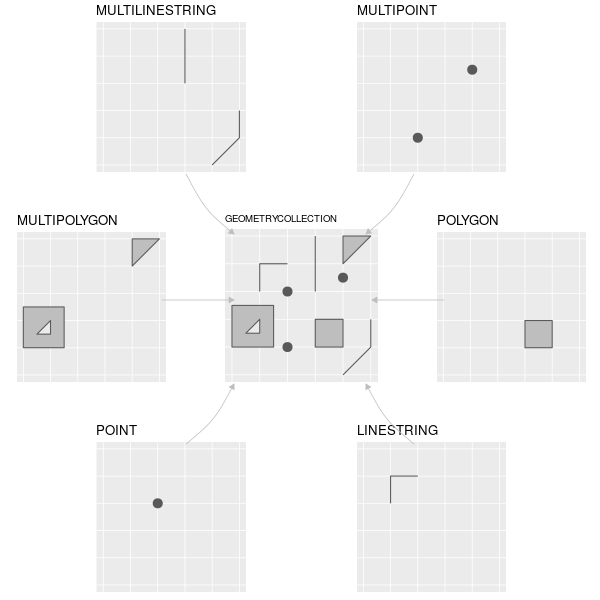
Most vector data that you use in everyday GIS work are so called “simple features.” Simple features are an open standard developed by the Open Geospatial Consortium (OGC). The most common feature types are displayed in figure 3.1.

Figure 3.1: The 7 (of 17) most important simple feature types. Image from Lovelace, Nowosad, and Muenchow (2021)
To handle these simple features in R, we need the library sf, and to import a vector dataset into R, we can use the function read_sf as in the example below.
library(sf)## Linking to GEOS 3.8.1, GDAL 3.1.4, PROJ 6.3.1ARE_waedenswil <- read_sf("sample_data/ARE_waedenswil.shp")
ARE_waedenswil## Simple feature collection with 13 features and 5 fields
## geometry type: MULTIPOLYGON
## dimension: XY
## bbox: xmin: 2689594 ymin: 1228563 xmax: 2694829 ymax: 1234095
## projected CRS: CH1903+ / LV95
## # A tibble: 13 x 6
## ID KLASSE KLASSE_DE KLASSE_FR KLASSE_NUM geometry
## <int> <chr> <chr> <chr> <dbl> <MULTIPOLYGON [m]>
## 1 69 D D - gering… D - faible… 4 (((2692378 1233048, 2692373 …
## 2 1371 D D - gering… D - faible… 4 (((2689720 1232195, 2689767 …
## 3 3578 D D - gering… D - faible… 4 (((2692766 1232135, 2692690 …
## 4 3591 D D - gering… D - faible… 4 (((2691861 1232707, 2691907 …
## 5 3696 A A - sehr g… A - très b… 1 (((2693943 1231286, 2693834 …
## 6 3901 B B - gute E… B - bonne … 2 (((2693183 1231097, 2693113 …
## 7 4137 B B - gute E… B - bonne … 2 (((2690970 1232339, 2690947 …
## 8 4161 B B - gute E… B - bonne … 2 (((2691724 1232478, 2691701 …
## 9 4225 B B - gute E… B - bonne … 2 (((2692266 1232198, 2692243 …
## 10 4401 C C - mittel… C - desser… 3 (((2694681 1230763, 2694659 …
## 11 5208 C C - mittel… C - desser… 3 (((2693064 1229206, 2693041 …
## 12 5319 C C - mittel… C - desser… 3 (((2690879 1233702, 2690856 …
## 13 5514 C C - mittel… C - desser… 3 (((2693168 1229907, 2693145 …And you are done! The shapefile is now imported into your R Session and you can start working with it. Much of the beauty in sf comes from it’s simplicity: As you see from importing the shapefile, it is very much like a data.frame, a structure that you probably know very well. In fact, it is a data.frame, as you can see here:
is.data.frame(ARE_waedenswil)## [1] TRUEsf provides methods for various generics, e.g. you can use plot() on the object for a simple visualisation. By default, using plot() on an sf object visualizes the geometry in small multiples, where each “facet” is colour coded based on a column in the dataset (see below). If you find this annoying (like I do), see chapter 4.1.
plot(ARE_waedenswil)