8.3 Reclass Toolset
library(raster)
library(arc2r)
library(dplyr)
8.3.1 Reclassify
In GIS quite often arises the necessity to reclassify a raster dataset. In other words, to create new classes with different range of values for the existing cell values of the dataset. This operation in ArcGIS Pro is performed using the Reclassify (Spatial Analyst) tool. In R the respective operation is quite straightforward and is based on the use of the reclassify function of the raster package. For our example we use the raster dataset swissAlti3D.
data("swissAlti3D")

plot(swissAlti3D)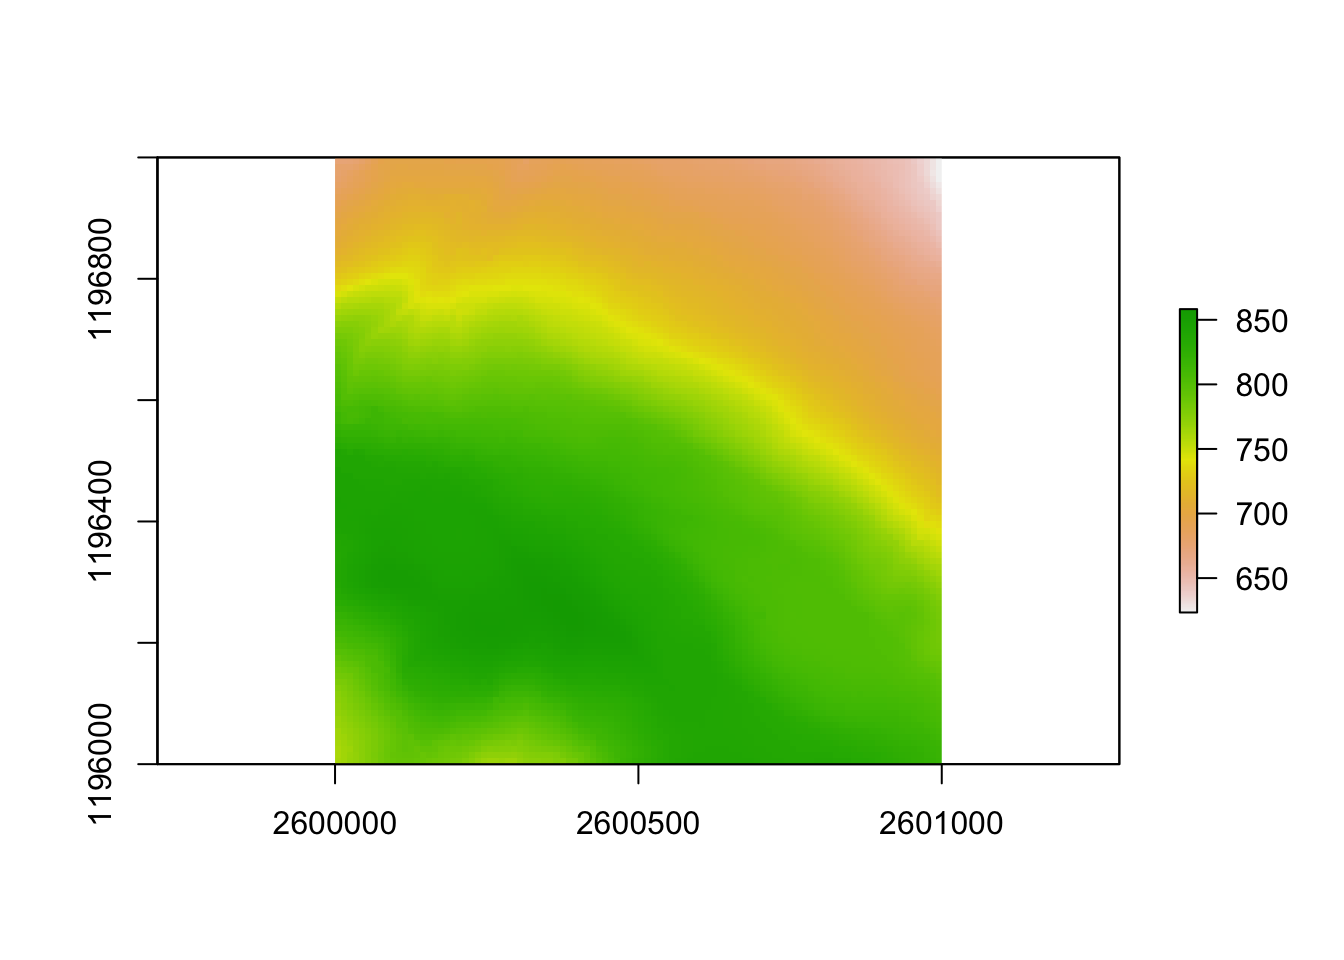
Let’s have a look at the histogram of the raster values to see their distribution.
histinfo <- hist(swissAlti3D)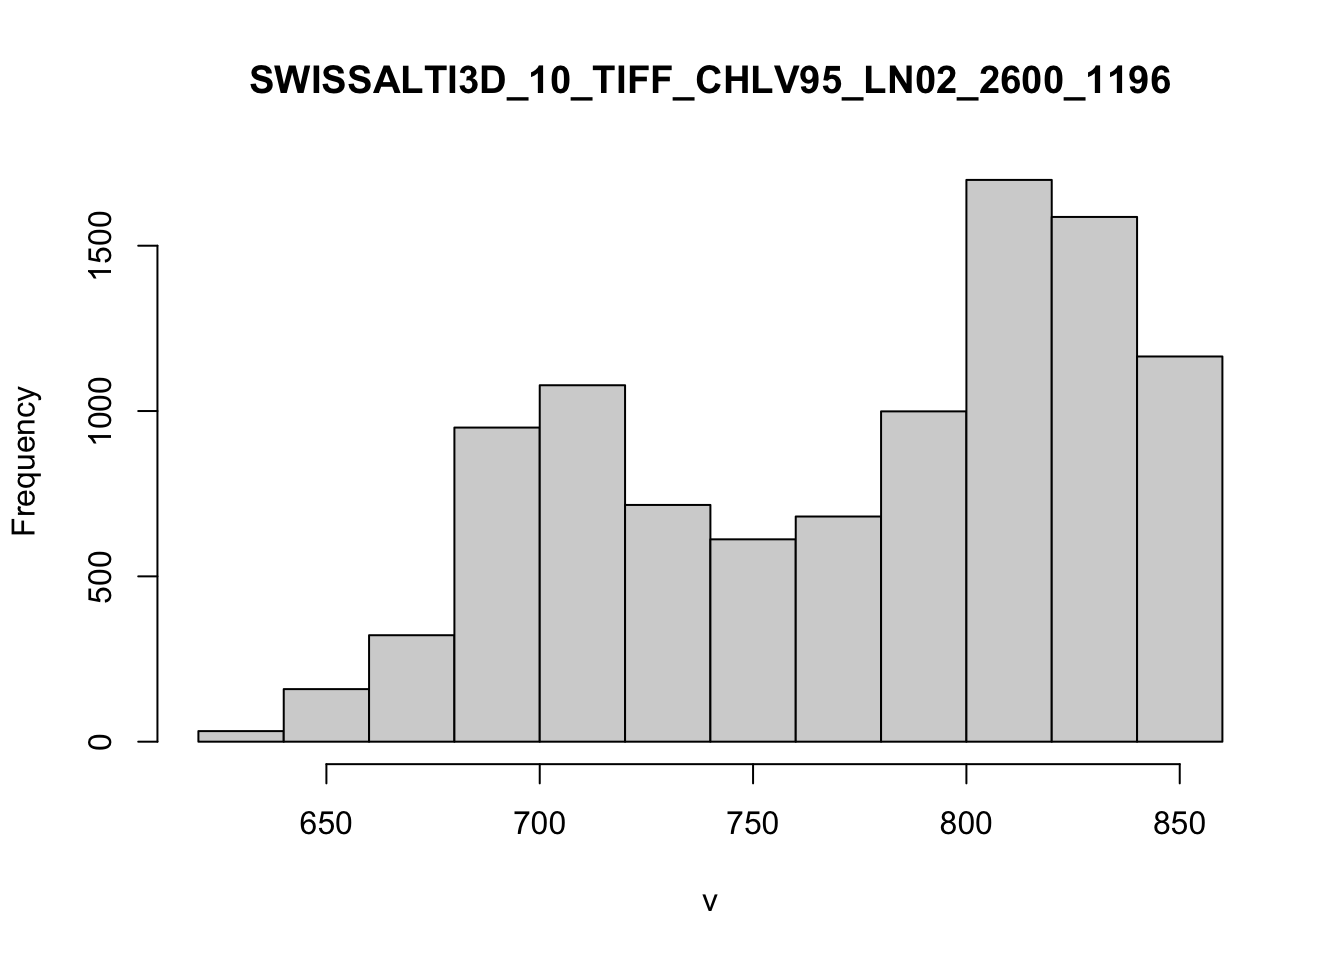
The histogram above automatically created 13 breaks (620,640,…,840,860). We can use these breaks to reclassify our values. To do so, we create below a reclassification matrix with the respective values.
# create a reclassification matrix
reclass_vec <- histinfo$breaks

reclass_m <- matrix(c(lag(reclass_vec, default = 0), reclass_vec, seq_along(reclass_vec)),
    ncol = 3)


reclass_m
## [,1] [,2] [,3]
## [1,] 0 620 1
## [2,] 620 640 2
## [3,] 640 660 3
## [4,] 660 680 4
## [5,] 680 700 5
## [6,] 700 720 6
## [7,] 720 740 7
## [8,] 740 760 8
## [9,] 760 780 9
## [10,] 780 800 10
## [11,] 800 820 11
## [12,] 820 840 12
## [13,] 840 860 13After creating the respective matrix with the new classes, we are ready to call the reclassify function. The function takes as a first argument the dataset set to be reclassified and as second the matrix, on which the reclassification is based on.
swissAlti3D_reclass <- reclassify(swissAlti3D, reclass_m)

plot(swissAlti3D_reclass)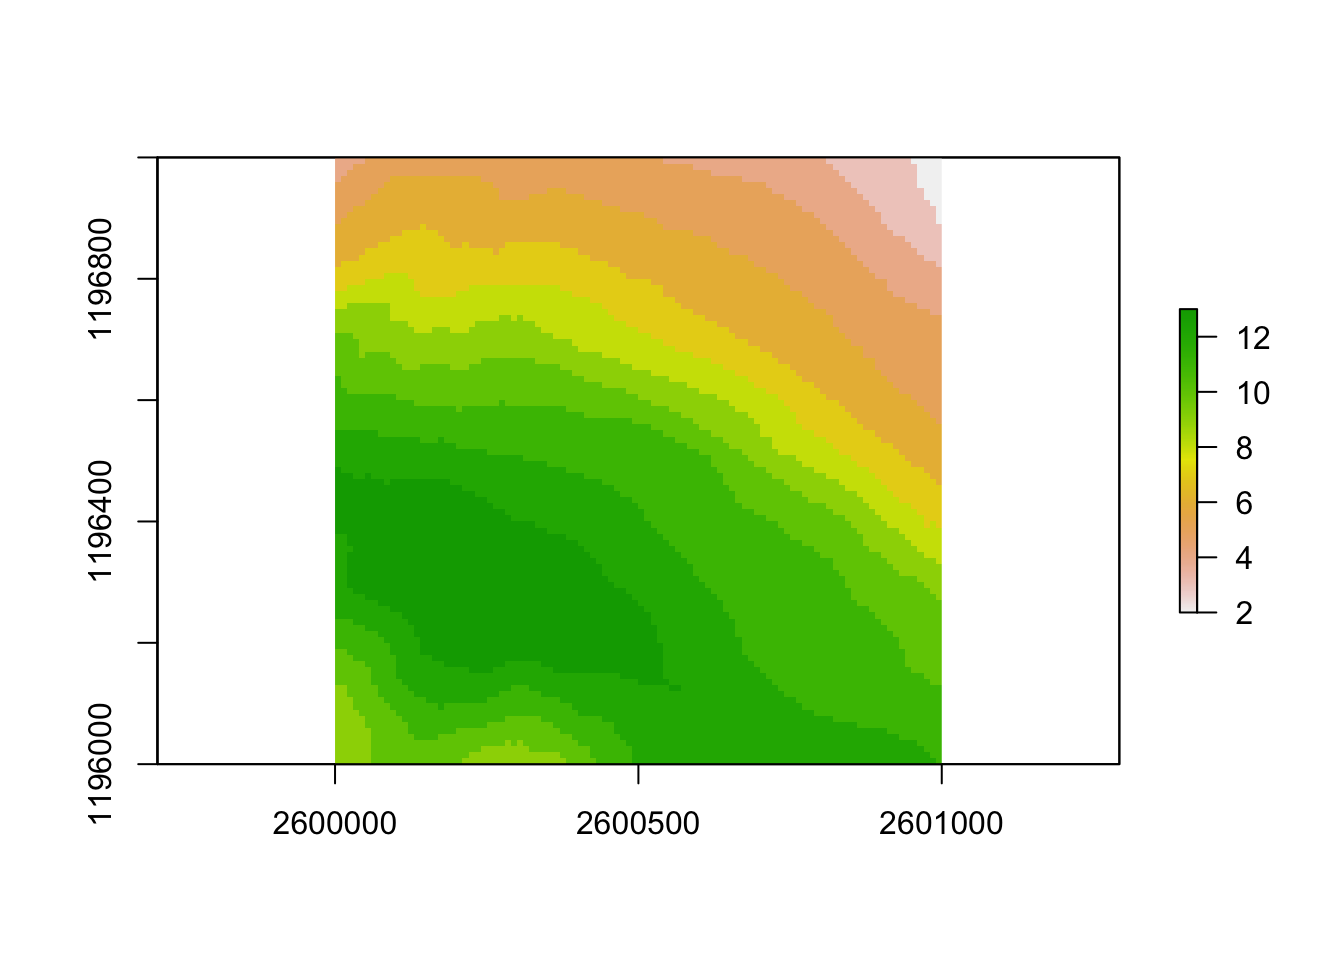
Figure 8.1: Aspect of swissALTI3D2019 in 4 classes