8.1 Neighborhood toolset
8.1.1 Focal Statistics
From the docs (Esri 2020):
Focal statistics performs a neighbourhood operation that computes an output raster, where the value for each output cell is a function of the values of all the input cells that are in a specified neighborhood around that location. The function performed on the input is a statistic, such as the maximum, average, or sum of all values encountered in that neighborhood.
In R in order to apply functions focally to rasters, important is to define the neighbouring cells. In other words to define the moving window for each of these functions. As an example below, we will create our own raster object.
r <- raster(ncol = 10, nrow = 10)
values(r) <- 1:ncell(r)
plot(r, main = "Raster with 100 cells", cex.main = 1)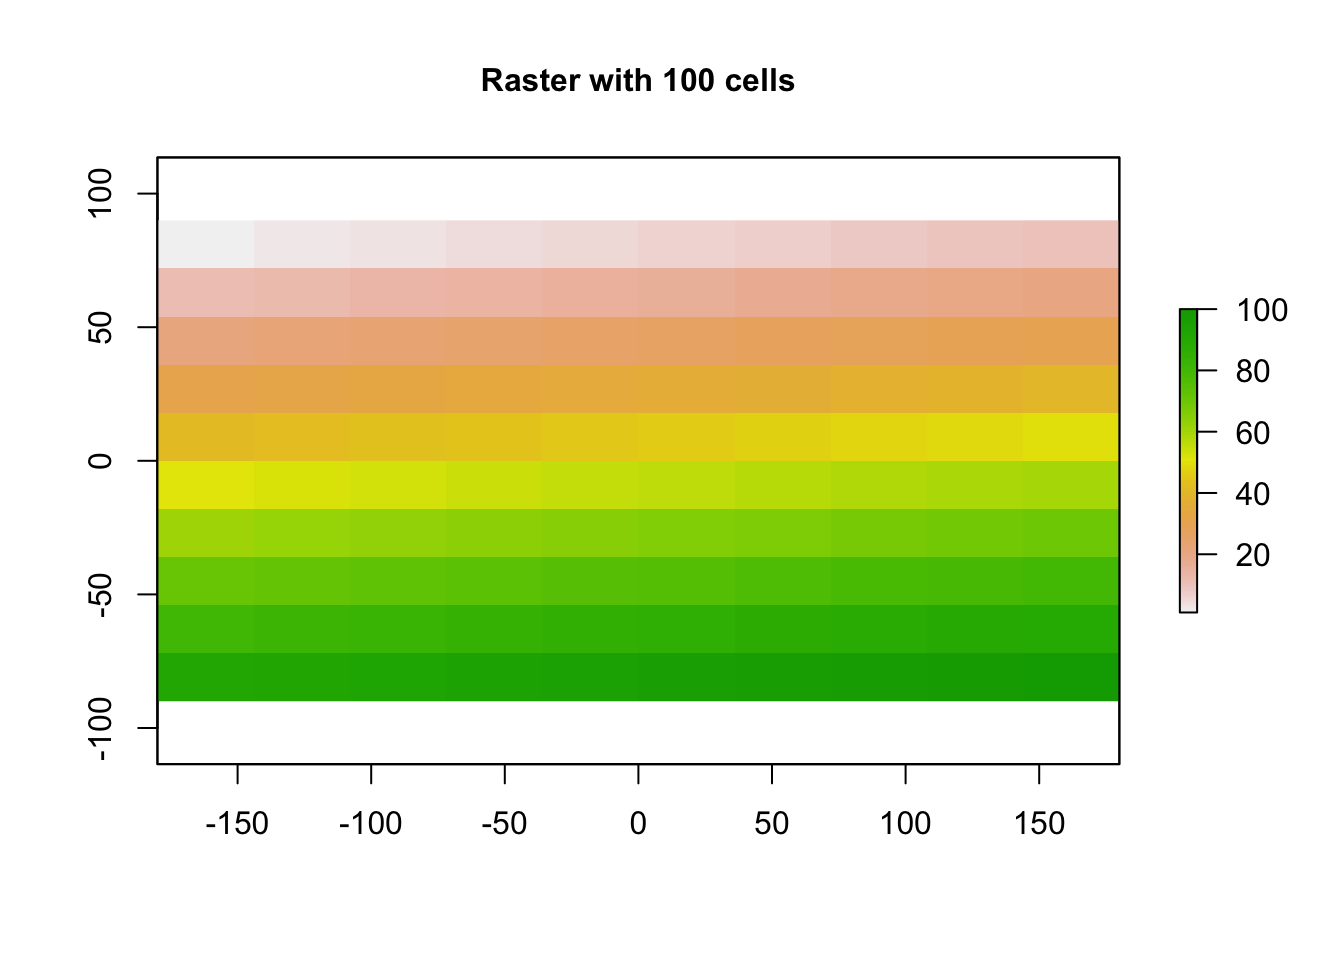
We will recompute now the raster based on the focal function of the raster package. In the function
below, the neighbourhood for which we apply the statistic is represented by the argument w, while the
statistic by the argument fun.
f1 <- focal(r, w = matrix(1, nrow = 3, ncol = 3), fun = sum)
plot(f1, main = "Raster after applying the focal function - raster package", cex.main = 1)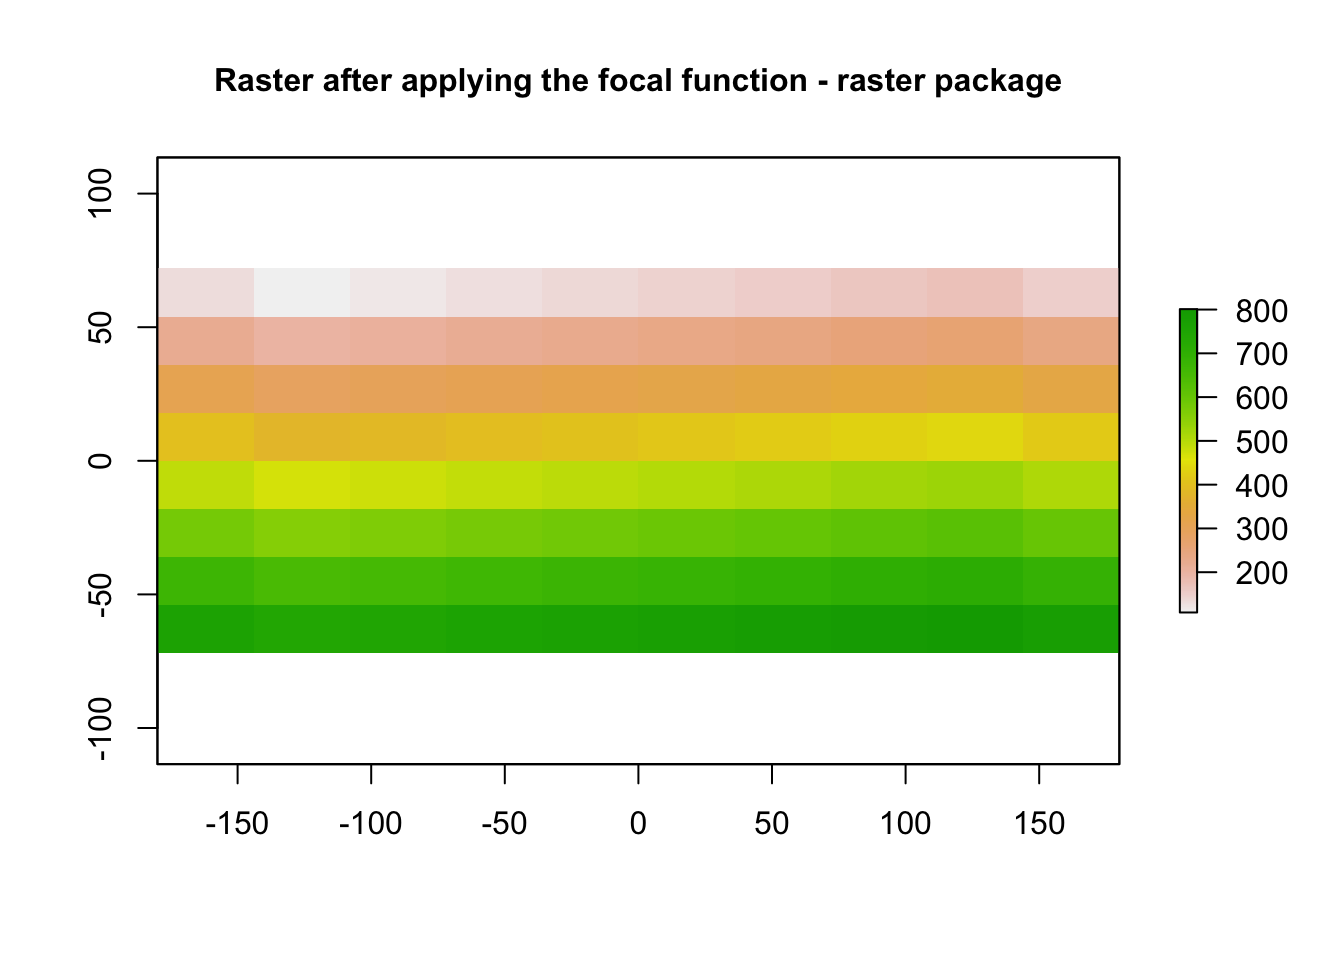
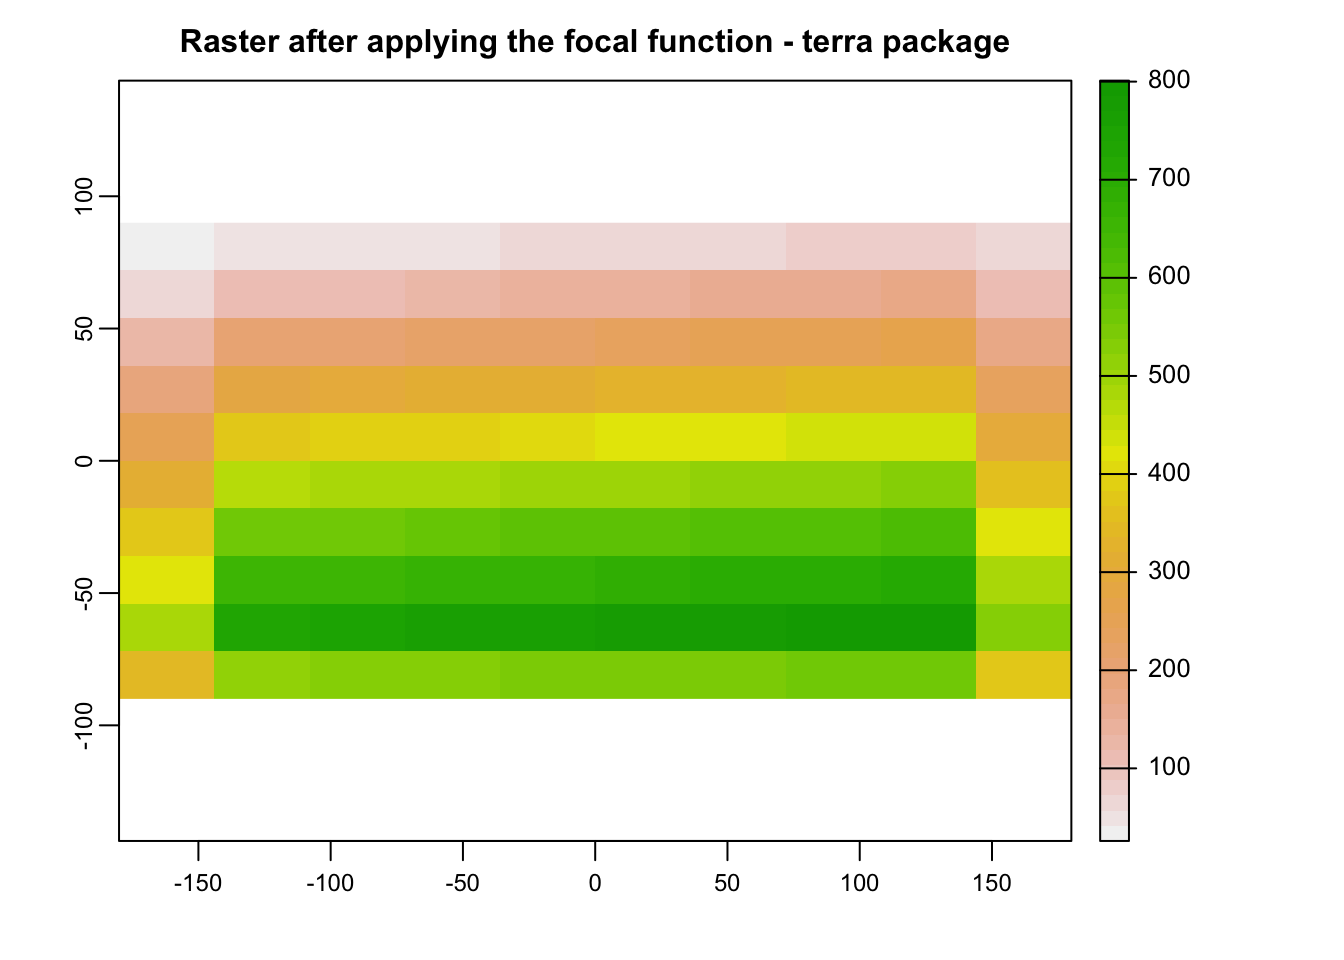
The operation above can be also performed with the use of the focal function of the terra package.
wrepresents the moving window of the function. The window can be defined as one (for a square) or two numbers (row, col); or with an odd-sized weights matrix. More details can be found here: https://rdrr.io/cran/terra/man/focal.htmlfunrepresents the specified statistic for the identified neighbourhood (e.g mean,sum etc)
r_spat <- as(r, "SpatRaster")
f2 <- terra::focal(r_spat, w = 3, fun = "sum")
plot(f2, main = "Raster after applying the focal function - terra package", cex.main = 1)