7.5 Sampling Toolset
For this chapter, you will need the following R Packages:
library(sf)
library(arc2r)
library(ggplot2)
library(dplyr)
7.5.1 Generate Tessellation
Generate Tessellation tool in ArcGIS pro is used for generating a tessellated grid of regular polygon features. The generated output is covering a certain extent that usually represents the respective extent of another spatial feature. The aforementioned operation in R is possible using the function st_make_grid of the sf package. Below we present an example of how we can create a tesselated grid covering the spatial extent of the canton of Zurich in Switzerland.
# Reading the simple feature object that depicts all the cantons of the country
# of Switzerland
data("kantonsgebiet")

# Selecting only the geometric extent of the canton of Zurich
zh <- filter(kantonsgebiet, NAME == "Zürich")

# Plotting the selected area
ggplot(zh) + geom_sf() + coord_sf(datum = 2056)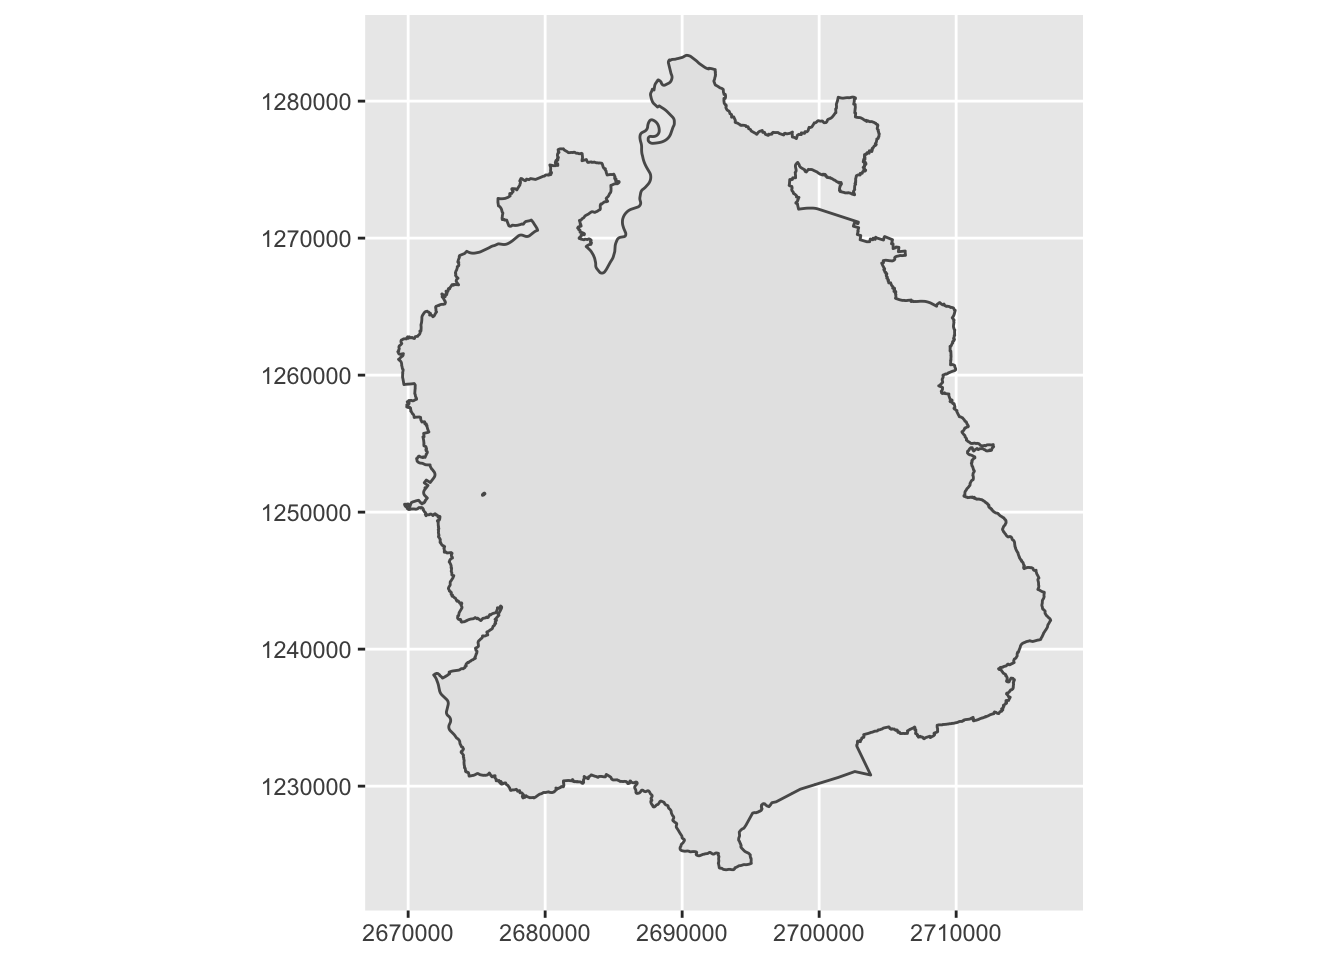
# Creating a tessellated grid of hexagons using the st_make_grid() function.
g <- st_make_grid(zh, square = FALSE)  # square = TRUE creates as expected a tesselation of squares

# Plotting the generated output over the spatial representation of the canton of
# Zurich
ggplot() + geom_sf(data = zh, fill = "red") + geom_sf(data = g, alpha = 0.3, color = "black") +
    coord_sf(datum = 2056) + ggtitle("Tesselated grid within the Canton of Zürich") +
    theme(plot.title = element_text(hjust = 0.5), text = element_text(size = 9))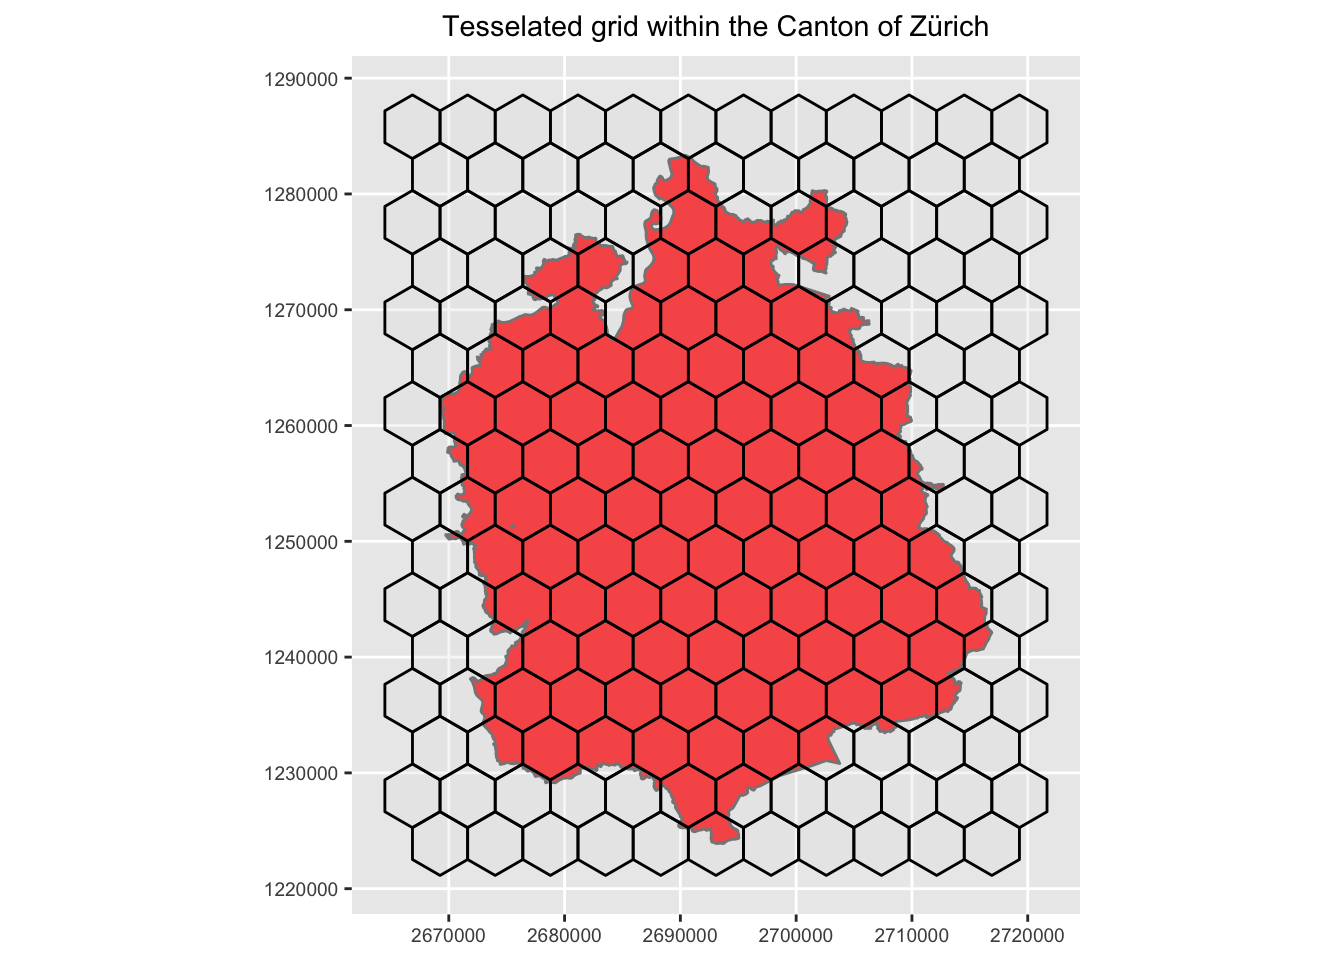
7.5.2 Create Random Points
Create Random Points tool in ArcGIS pro serves as a very straightforward way of generating randomly distributed points within an extent window, inside polygon features, on point features, or along line features. In R the respective operation can be again achieved using one of the functions provided by the sf package. Below we present how we can perform this operation with the function st_sample().
# Create random points (1000) within the spatial extent of the Canton of Zurich
sample <- st_sample(zh, size = 1000)

# Plotting the randomly generated points over the spatial feature that represents
# the canton of Zurich
ggplot() + geom_sf(data = zh) + geom_sf(data = sample) + coord_sf(datum = 2056) +
    ggtitle("1000 random points witihn the Canton of Zurich")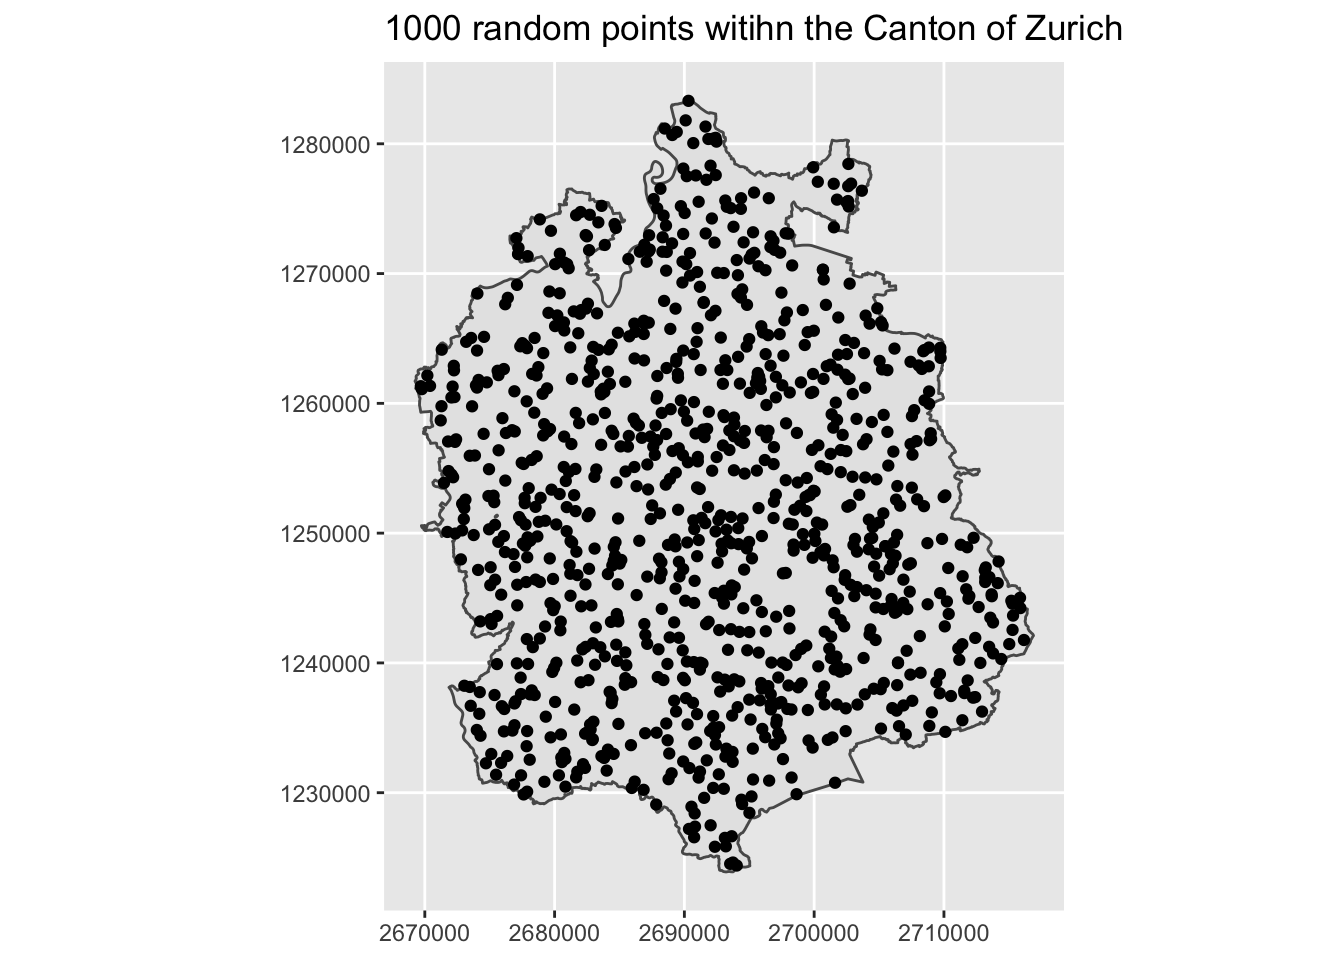
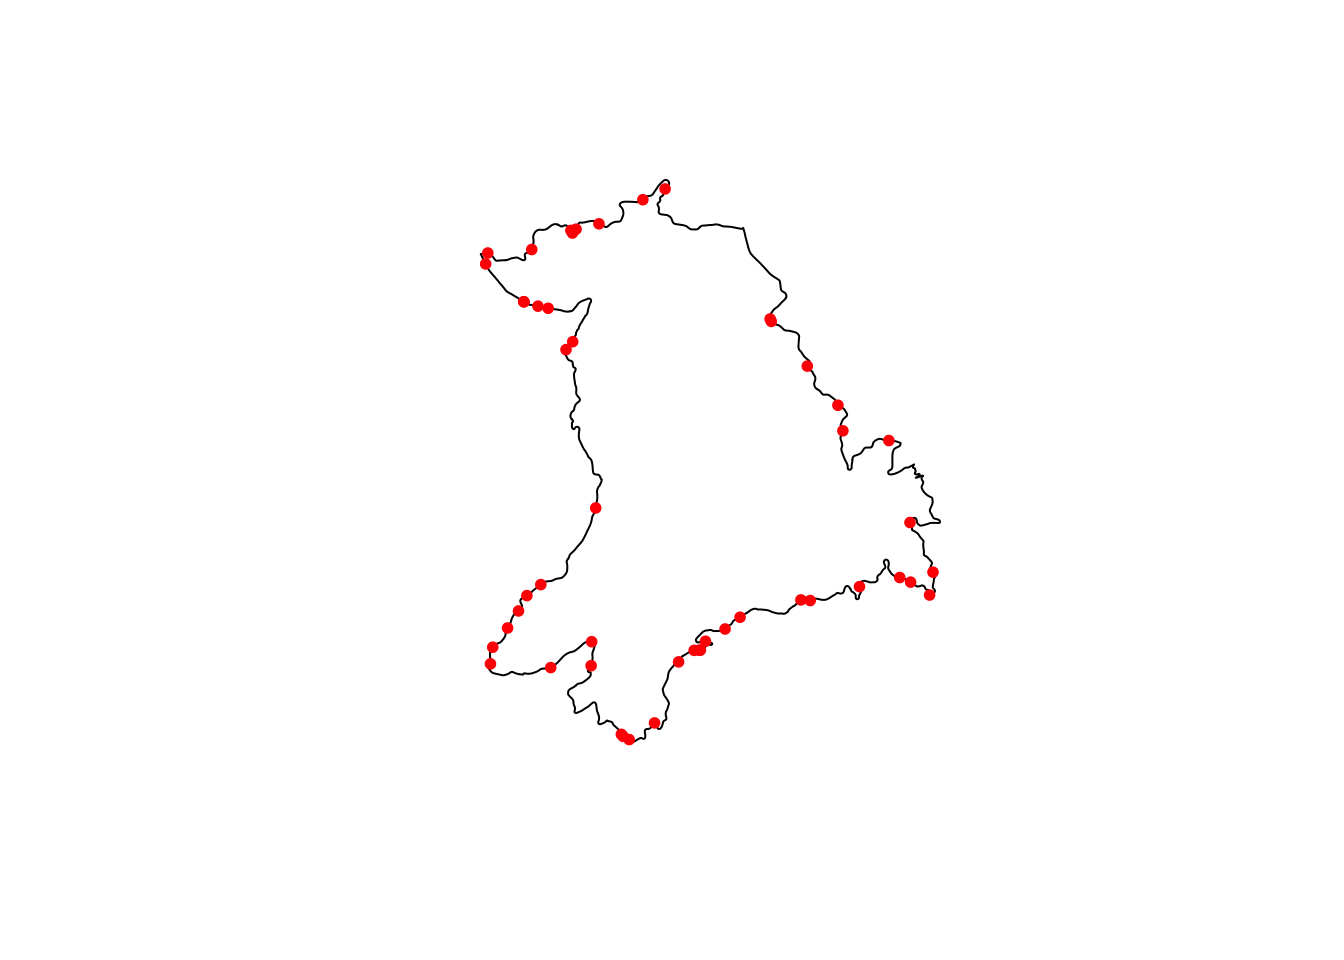
7.5.3 Generate Points Along Lines
data("mountainBikes_routes")

line1 <- mountainBikes_routes[1, ]
pointsOnLine1 <- st_line_sample(line1, 50, type = "random")


plot(st_geometry(line1))
plot(pointsOnLine1, add = TRUE, pch = 20, col = "red")