3.2 Importing raster data with raster
For this chapter, you will need the following R Packages:
library(raster)## Loading required package: spTo import raster data, we need a package that can specifically handle raster datasets. The package raster has for a long time been the go-to package for this. However, this package is currently in the process of being replaced with a successor, terra. Since raster is still in heavy use, we will show you how you handle raster data with this package.
3.2.1 Single band raster
Download the sample dataset here and unzip it into your project folder. This dataset is a freely available sample for the swissALTI3D data. The full sample, including files at different resolutions, can be downloaded from here.
Now load the library raster the function raster to import the tif-file included in the zip file. Make sure you have set the path to your tif-file correctly.
library(raster)

swissAlti3D <- raster("sample_data/SWISSALTI3D_10_TIFF_CHLV95_LN02_2600_1196.tif")
## Warning in showSRID(uprojargs, format = "PROJ", multiline = "NO", prefer_proj
## = prefer_proj): Discarded datum Unknown based on Bessel 1841 ellipsoid in Proj4
## definitionThe dataset is now imported into your project and ready to be viewed, analysed and processed. If we call the object in our console, we can see that the dataset was imported as a RasterLayer and can see some important statistics which you would typically find via Layer Properties -> Source in ArcGIS.
swissAlti3D## class : RasterLayer
## dimensions : 100, 100, 10000 (nrow, ncol, ncell)
## resolution : 10, 10 (x, y)
## extent : 2600000, 2601000, 1196000, 1197000 (xmin, xmax, ymin, ymax)
## crs : +proj=somerc +lat_0=46.9524055555556 +lon_0=7.43958333333333 +k_0=1 +x_0=2600000 +y_0=1200000 +ellps=bessel +units=m +no_defs
## source : /Users/runner/work/book/book/sample_data/SWISSALTI3D_10_TIFF_CHLV95_LN02_2600_1196.tif
## names : SWISSALTI3D_10_TIFF_CHLV95_LN02_2600_1196
## values : 623.3814, 858.2705 (min, max)To visualize the dataset, we can simply call plot on our new object.
plot(swissAlti3D)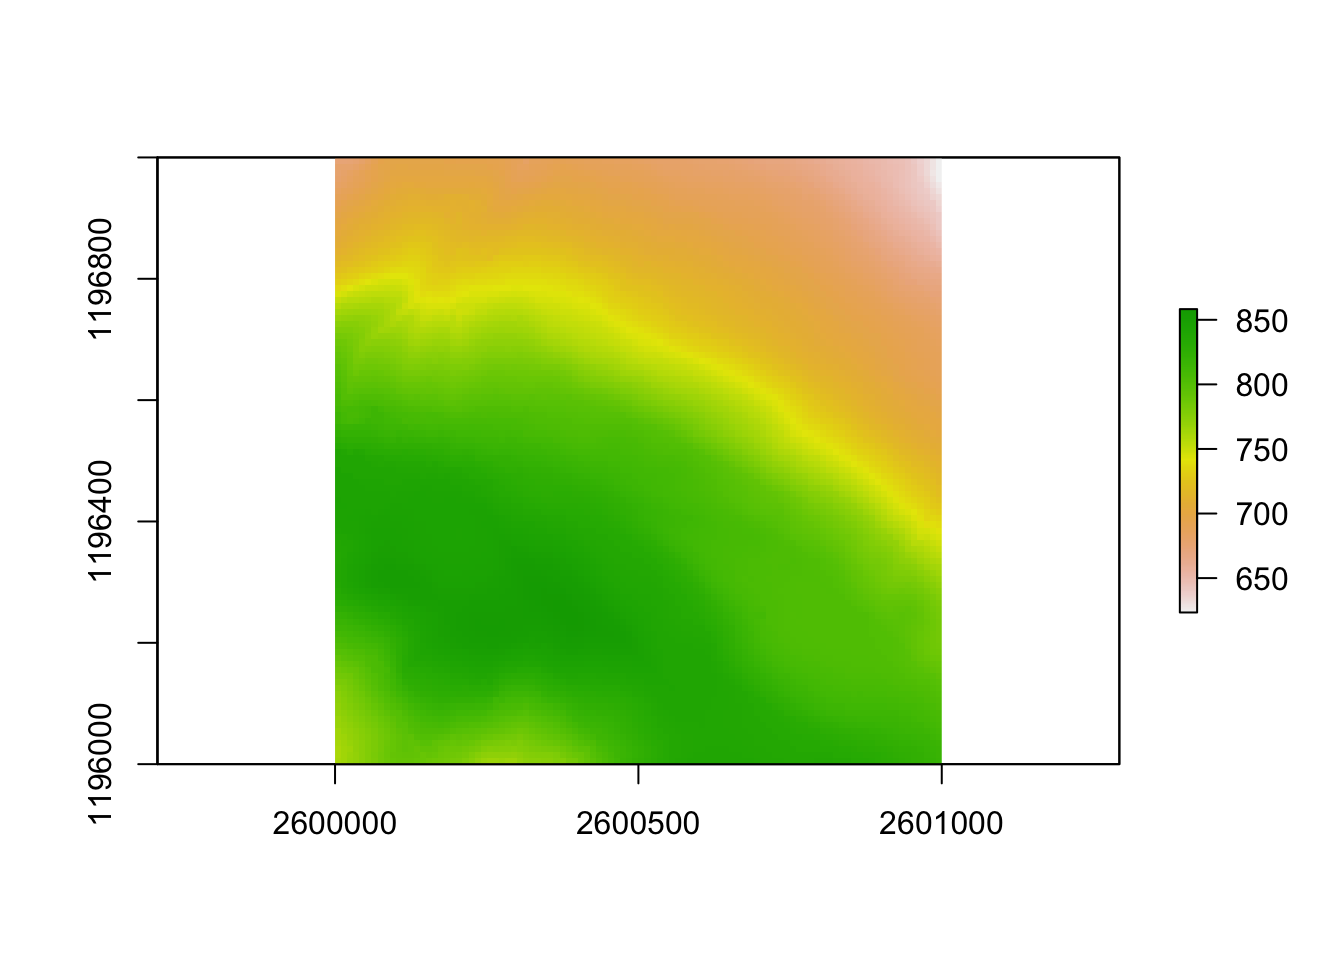
3.2.2 Multiband Raster
//todo explain how to import multiband raster