10.1 Map Algebra Toolset
For this chapter, you will need the following R Packages:
library(arc2r)
library(raster)
library(terra)
10.1.1 Raster Calulator
In GIS Softwares (ArcGIS pro, QGIS etc) Raster Calculator is one of the most
commonly used tools for performing various operations with raster datasets.
For the example below we will work with 2 datasets that depict India’s population at two different timestamps. Our goal is to produce an output raster that demonstrates the evolvement of country’s population in this 10 years timespan. Naturally in ArcGIS pro, the aforementioned operation would be performed with the use of Raster Calculator. Let’s explore our options with R.
# India's population in 2000
data("pop_india2000")

# India's population in 2010
data("pop_india2010")

par(mfrow = c(1, 2))
plot(pop_india2000)
plot(pop_india2010)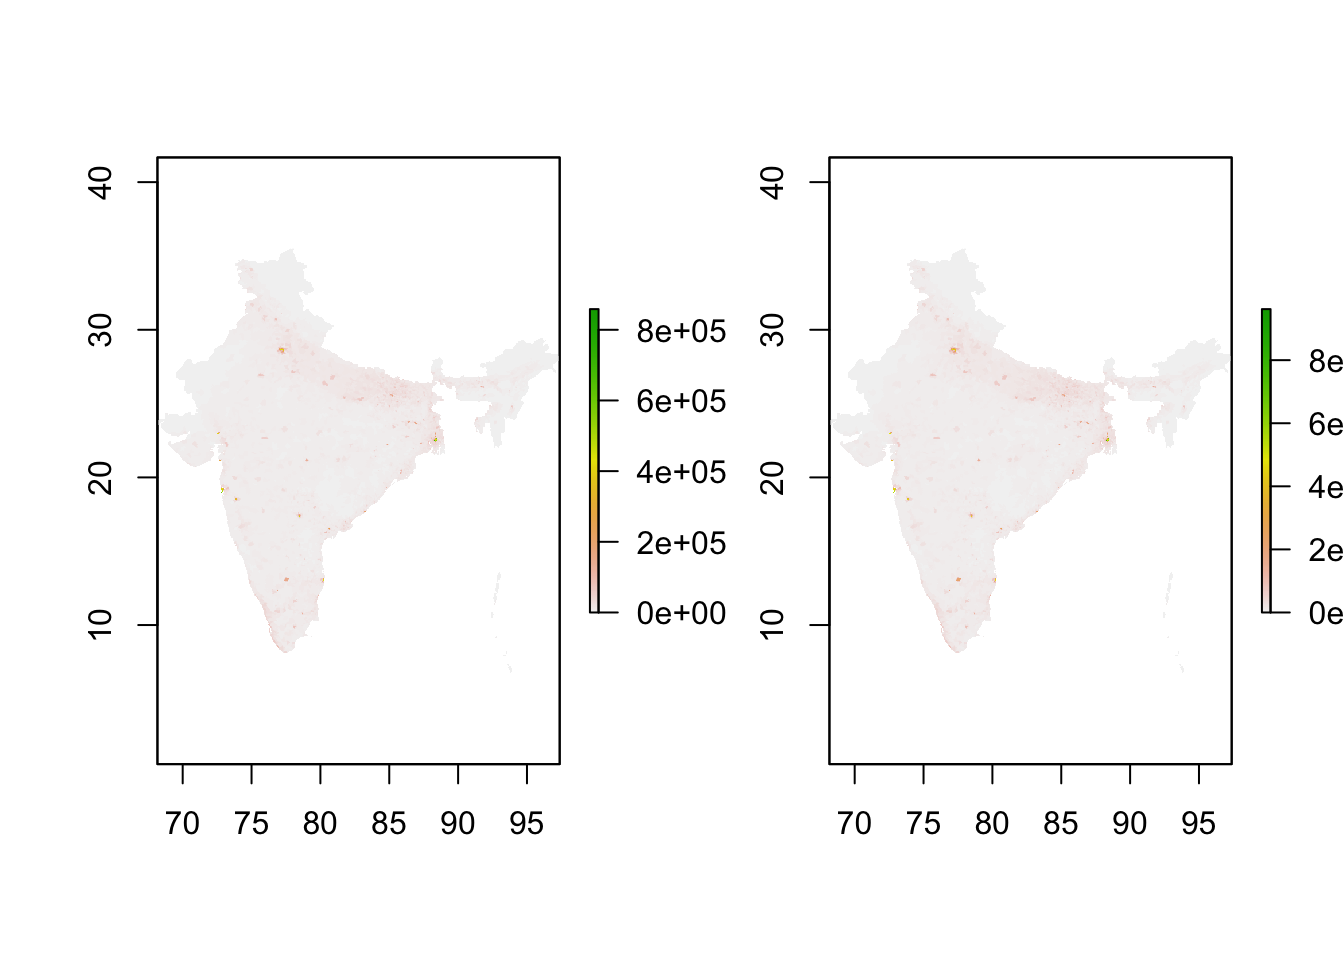
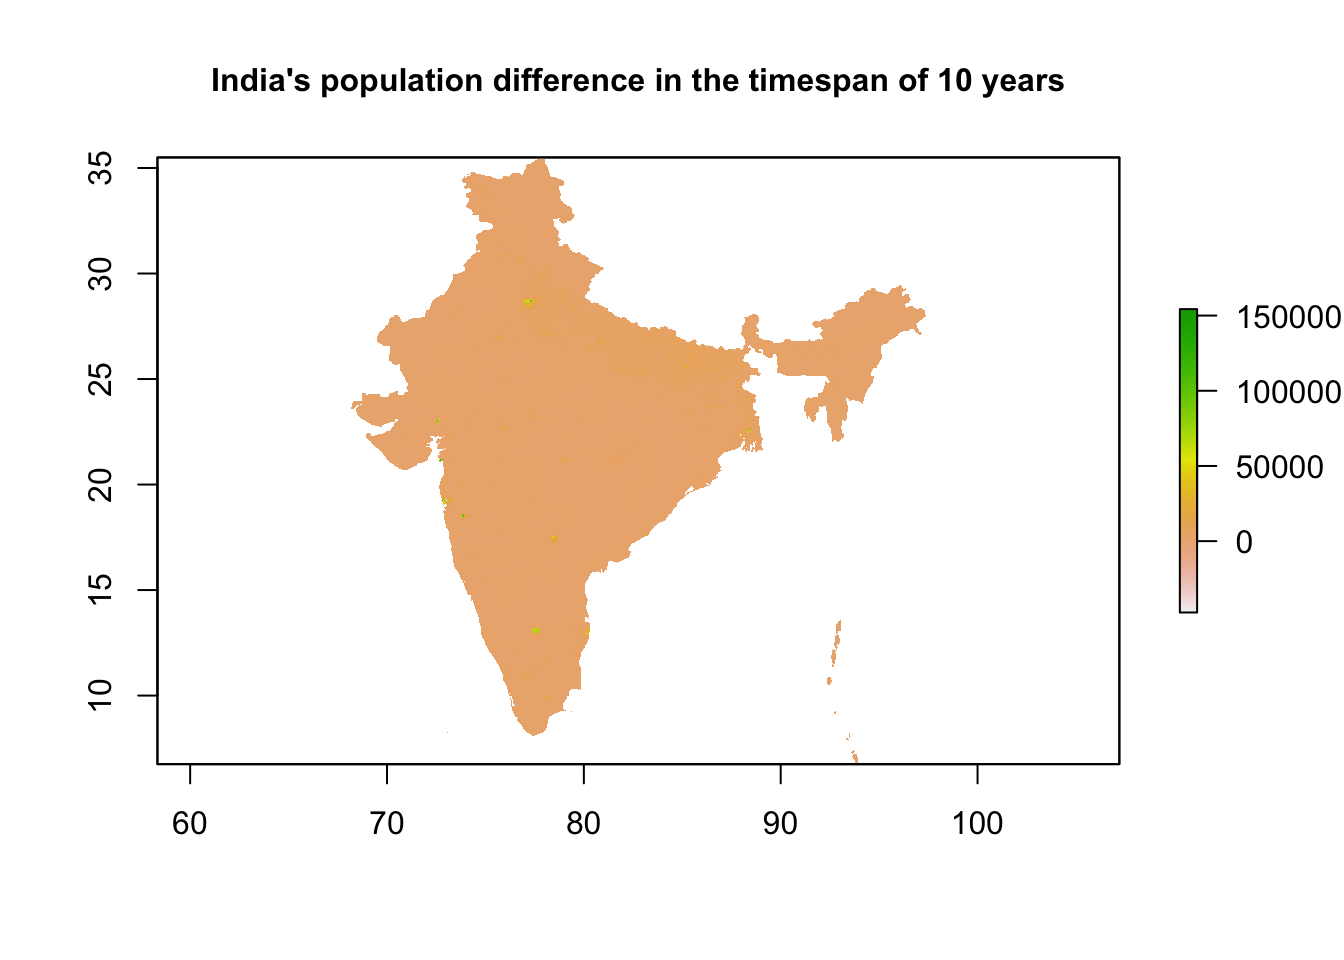
Let’s compute now the difference between the two rasters. To do so, there are various options. As first we can create a function that performs a simple subtraction of two rasters.
diff_rasters <- function(b1, b2) {
    # this function calculates the difference between two rasters of the same CRS and
    # extent input: 2 raster layers of the same extent, crs that can be subtracted
    # output: a single different raster of the same extent, crs of the input rasters
    diff <- b2 - b1
    return(diff)
}
Since, we created the function for subtracting one raster from another, we use now
the function overlay of the raster package for producing the new raster output.
# Compute the raster that depicts the difference in population in these 10 years
pop2010_2000 <- overlay(pop_india2000, pop_india2010, fun = diff_rasters)

plot(pop2010_2000, main = "India's population difference in the timespan of 10 years",
    cex.main = 1)